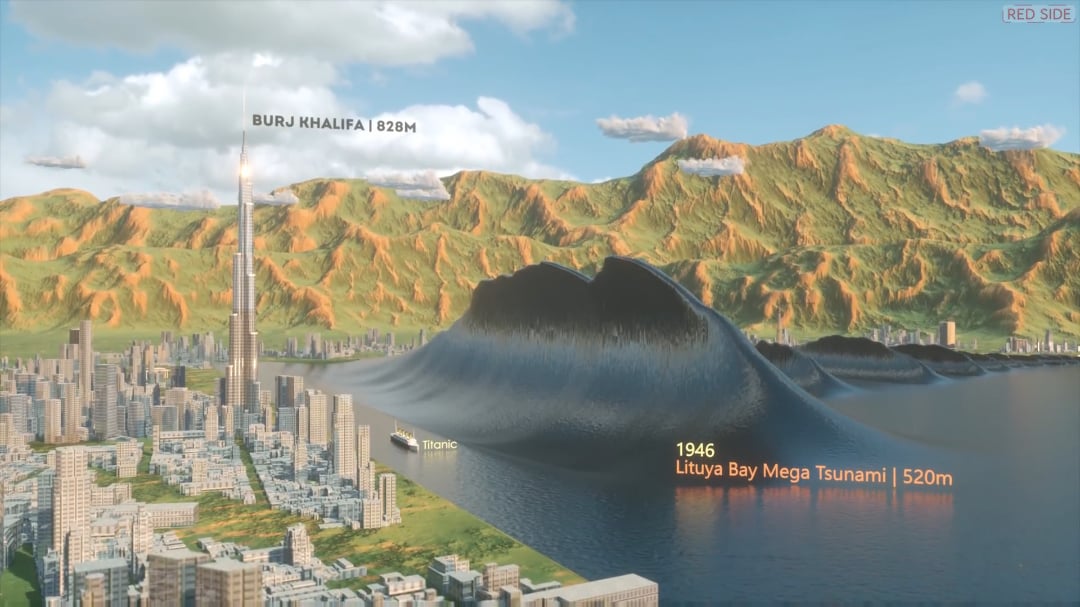
A comparative view of scales of Tsunami waves
A Comparative View of Tsunami Measurement Scales: Understanding Magnitude, Intensity, and Impact
Tsunamis are among the most devastating natural disasters, capable of obliterating coastal communities in mere minutes. Measuring these colossal waves is essential for both scientific research and disaster preparedness—yet unlike earthquakes, tsunamis lack a single unified scale. Instead, multiple scales exist to quantify their size, power, and impact. In this article, we’ll explore and compare these frameworks, shedding light on how scientists, engineers, and policymakers assess tsunami risks and respond to threats.
Why Measure Tsunamis? The Need for Classification
Tsunami scales serve three key purposes:
- Scientific analysis: Tracking wave heights, speeds, and propagation patterns.
- Early warnings: Issuing timely alerts based on expected intensity.
- Disaster response: Quantifying damage to prioritize relief efforts.
Without standardized metrics, comparing historical tsunamis or predicting future impacts would be nearly impossible. Below, we break down the most widely used scales.
Tsunami Magnitude vs. Intensity: What’s the Difference?
Unlike earthquakes, which distinguish between magnitude (energy released) and intensity (ground shaking effects), tsunami measurement blurs these lines. Two approaches dominate:
-
Magnitude Scales:
- Focus on physical wave characteristics, such as height or energy.
- Examples: Imamura-Iida Scale, Tsunami Magnitude (Mt).
-
Intensity Scales:
- Assess observed impacts on coastlines and infrastructure.
- Examples: Sieberg-Ambraseys Scale, Modified Mercalli Intensity (MMI) adapted for tsunamis.
Let’s dive into each system.
The Imamura-Iida Scale: A Historical Benchmark
Developed in the 1940s, this scale measures tsunamis based on maximum wave height (m) and assigns a magnitude from -1 to 4:
| Magnitude | Wave Height | Potential Damage |
|---|---|---|
| -1 | < 0.5m | Minor; detected only by instruments |
| 0 | ~1m | Noticeable in bays; minimal damage |
| 1 | 2–4m | Coastal flooding; light damage |
| 2 | 4–8m | Significant flooding; structural damage |
| 3 | 8–16m | Severe destruction to coastal towns |
| 4 | >16m | Catastrophic; wipe out entire regions |
Pros: Simple, easy to apply historically.
Cons: Doesn’t account for inundation distance or speed.
The Sieberg-Ambraseys Tsunami Intensity Scale
Focused on impacts, this qualitative scale categorizes tsunamis from I (very light) to VI (disastrous) based on observed effects:
- I: Instrumentally recorded, no coastal damage.
- III: Light flooding, boats displaced.
- IV: Moderate structural damage (e.g., broken windows, eroded beaches).
- VI: Complete devastation; boulders and ships carried inland.
Pros: Useful for post-disaster assessment.
Cons: Subjective; relies on eyewitness accounts.
Modern Solutions: The Integrated MTI Scale
To bridge gaps, Japan’s Meteorological Agency developed the MTI (Maruoka-Tatehoko-Iwai) Scale, combining wave height, inundation distance, and socio-economic impact:
| MTI Level | Wave Height | Inundation | Impact |
|---|---|---|---|
| 1 (Minor) | <1m | <50m inland | Localized flooding |
| 2 (Moderate) | 1–3m | 50m–1km | Infrastructure damage |
| 3 (Major) | 3–10m | 1–3km | Widespread destruction |
| 4 (Severe) | >10m | >3km | Regional catastrophe |
Pros: Holistic; accounts for run-up distance and human impact.
Cons: Requires precise post-event surveys.
How Tsunami Scales Influence Warning Systems
- NOAA’s Pacific Tsunami Warning Center (PTWC): Uses real-time buoy data and magnitude estimates to issue alerts (e.g., “Tsunami Warning” vs. “Advisory”).
- Japan’s JMA System: Employs MTI rankings to trigger evacuations (e.g., Level 3 = evacuate immediately).
Comparing Historical Tsunamis: Scale Applications
| Event | Wave Height | Imamura-Iida | Sieberg-Ambraseys | MTI |
|---|---|---|---|---|
| 2004 Indian Ocean (Sumatra) | 30m+ (locally) | 4 | VI (Disastrous) | 4 (Severe) |
| 2011 Tōhoku (Japan) | 40m (max) | 4 | VI (Disastrous) | 4 (Severe) |
| 1960 Valdivia (Chile) | 25m | 4 | VI (Disastrous) | 4 (Severe) |
| 2018 Sulawesi (Indonesia) | 6m | 2–3 | IV (Strong) | 3 (Major) |
Key Takeaways
- No one-size-fits-all: Scales serve different purposes (magnitude vs. intensity vs. impact).
- Height isn’t everything: Inundation distance, speed, and debris amplify destruction.
- Modern systems blend data: MTI and computational models now drive real-time warnings.
FAQs About Tsunami Scales
Q: Why isn’t there a universal tsunami scale?
A: Tsunamis vary wildly in cause (earthquakes, landslides, volcanoes), making single-scale standardization challenging.
Q: Can small tsunamis be dangerous?
A: Yes—even 1m waves can cause deadly rip currents and harbor damage.
Q: How do AI and satellite tech improve measurement?
A: Machine learning models now predict wave heights and inundation maps within minutes of seismic events.
Conclusion: The Future of Tsunami Measurement
As climate change amplifies coastal hazards, refining tsunami scales is critical. Emerging tools like AI-driven simulations and global sensor networks aim to integrate magnitude, intensity, and real-time impact data—saving lives by turning raw numbers into actionable intelligence. For coastal communities, understanding these scales isn’t just academic—it’s the foundation of resilience.
Target Keywords: Tsunami measurement scale, tsunami magnitude vs intensity, Imamura-Iida scale, Sieberg-Ambraseys scale, MTI tsunami scale, tsunami wave height, tsunami impacts.
Meta Description: Explore how tsunami waves are measured! We compare major scales—Imamura-Iida, Sieberg-Ambraseys & MTI—and explain their role in disaster response. Plus, real-world examples.