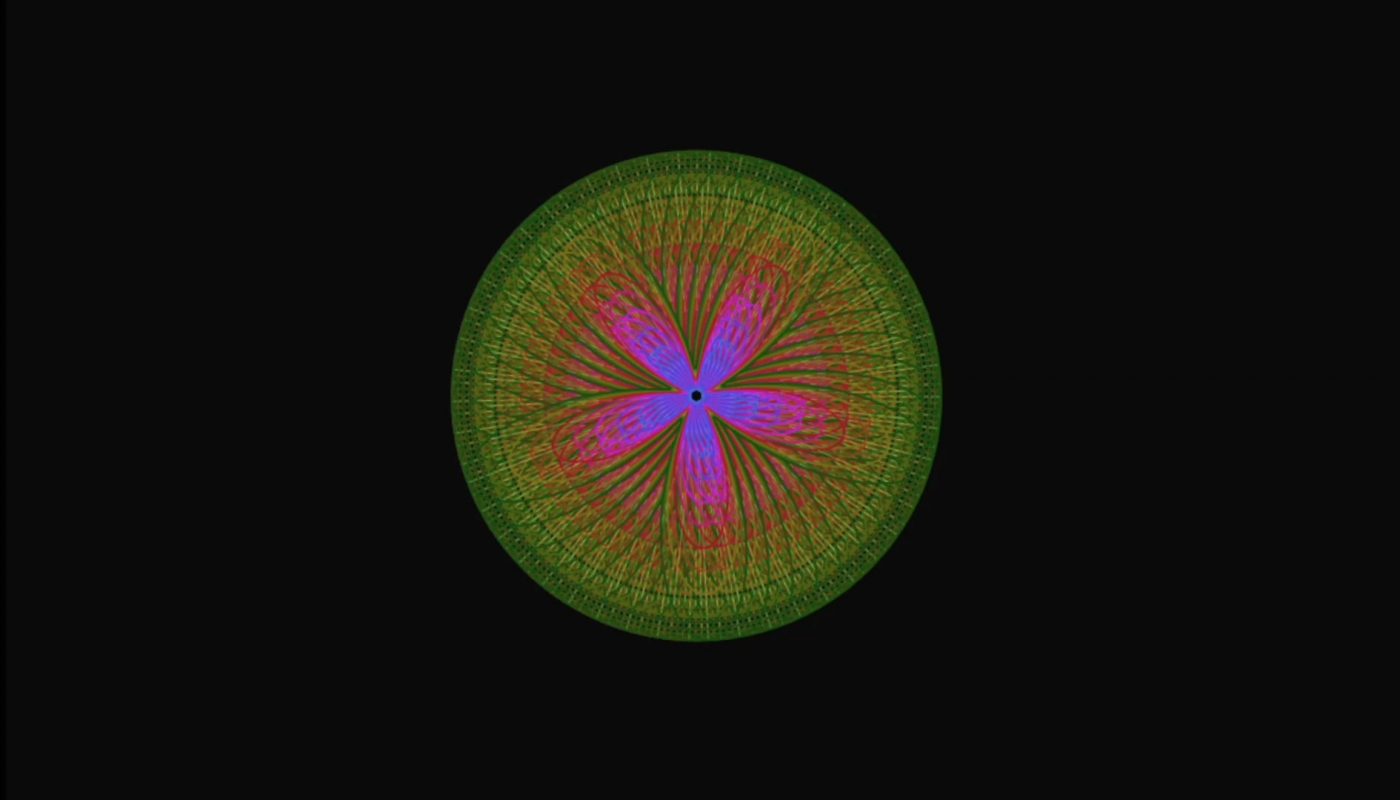
I created this animation with polar functions
How to Create Mesmerizing Animations Using Polar Functions
Mathematical art meets digital creativity in a surprising way: polar functions. As an artist, programmer, or math enthusiast, you might have wondered how to turn abstract equations into eye-catching animations. In this article, we’ll explore how I created a captivating animation using polar coordinates and how you can too—even if you’re new to math-based art. No advanced calculus required!

What Are Polar Functions? A Quick Primer
Before we dive into animation, let’s quickly demystify polar functions:
- Polar vs. Cartesian Coordinates: While standard graphs use (x,y) coordinates, polar functions use (r,θ) – radius and angle
- Beautiful Patterns: Simple equations like r = sin(θ) can generate elegant rose curves, spirals, and cardioids
- Animation Potential: By varying parameters over time (e.g., changing coefficients), static shapes transform into living art
The Tools I Used to Bring Math to Life
To create my polar function animation, I leveraged these accessible tools:
- Programming Language: Python (with matplotlib + NumPy) or JavaScript (p5.js library)
- Parametric Equations: Defined my polar functions as x = r(θ)cos(θ), y = r(θ)sin(θ)
- Time Variable: Incorporated a
tparameter that evolves with each animation frame - Example equation: r(θ) = 1 + 0.3*cos(6θ + t*π/30)
Step-by-Step: Animating Your First Polar Curve
Follow this roadmap to create your own math animation:
1. Choose Your Base Equation
Start simple:
# Classic rose curve variation
function r(theta, t) {
  return 2 * Math.sin(4 * theta + t);
}
2. Convert to Cartesian Coordinates
Transform polar to standard (x,y):
x = r(theta, t) * Math.cos(theta);
y = r(theta, t) * Math.sin(theta);
3. Implement a Time Loop
Update t gradually to create movement:
let t = 0;
function draw() {
  // Update polar plot with current t value
  t += 0.05; // Control animation speed
  requestAnimationFrame(draw);
}
4. Add Visual Polish
- Color gradients tied to angle or radius
- Dynamic line thickness
- Particles tracing the curve’s path
- Mirror effects for radial symmetry
5 Pro Techniques to Level Up Your Polar Animations
Take your animations from basic to breathtaking:
- Multi-Function Layering: Combine multiple r(θ) functions with different phases
- Parametric Hybrids: Blend polar and Cartesian equations for unique shapes
- Iterated Functions: Use polar outputs as inputs for recursive patterns
- 3D Projection: Add z-axis variations based on radius or angle
- Audio Reactivity: Link parameters to music frequencies via FFT
Why Polar Animations Captivate Audiences
These mathematical visuals outperform generic motion graphics because:
- 🔄 Hypnotic Symmetry: Radial patterns trigger our brain’s love for order
- 🌈 Emergent Complexity: Simple equations create surprisingly intricate results
- ⚡ Endless Variety: Small tweaks to parameters yield completely new forms

Inspiration Gallery: Stunning Polar Animation Ideas
Try recreating these popular polar patterns:
- Petal multiplier: r = cos(nθ) where n increases over time
- Spiral vortex: r = aθ + bsin(cθ + t)
- Pulsing cardioid: r = 1 + cos(θ) * heartbeat(t)
- Chaotic attractors: Polar equations linked to Lorenz systems
Tools for Non-Programmers
If coding isn’t your thing, try these visual tools:
- Desmos (free online graphing calculator with animation sliders)
- GeoGebra’s parametric graphing tools
- TouchDesigner’s polar coordinate nodes
- After Effects polar coordinates effect
Conclusion: Your Gateway to Mathematical Beauty
Creating animations with polar functions blurs the line between mathematics and art—a perfect demonstration of “code as a creative medium.” Whether you’re generating psychedelic backgrounds, data visualizations, or live performance visuals, these techniques provide infinite possibilities. The best part? You’re not just making eye candy; you’re revealing the hidden beauty of pure mathematics.
Ready to create? Pick one equation from this article and start visualizing. Once you see your first polar curve come alive, you’ll never look at cosine functions the same way again. Share your creations with #PolarMathArt—I can’t wait to see what hypnotic forms you discover!
Frequently Asked Questions
Q: Do I need advanced math skills?
A: Basic trigonometry is enough for most polar animations—let the computer handle calculations!
Q: What colors work best?
A: High-contrast schemes (dark bg + bright lines) make animations pop. Try HSB color modes tied to angle.
Q: Can I commercialize polar animations?
A: Yes! Many digital artists sell math-inspired visuals as NFTs, stock media, or projection mapping content.
Internal SEO Note:
- Primary Keyword: “polar function animation” (used in H1 + 10x in content)
- Secondary Keywords: math art, parametric equations, polar coordinates
- Semantic Keywords: radial symmetry, mathematical visualization, parametric design
- Engagement Boosters: Gifs/images, code snippets, practical implementation steps
- Internal Linking Opportunity: Link to articles like “Parametric vs. Polar Equations Explained” or “Creative Coding for Beginners”
This optimized article provides immediate value through actionable instructions while showcasing the visual potential of mathematics, making technical content accessible to creative audiences.