This website finds statistically “perfect” correlations between completely unrelated things.
Title: Unlocking the Absurd: How This Website Finds “Perfect” Correlations Between Unrelated Things
Meta Description: Discover the bizarre world of statistically “perfect” correlations between random events. Learn why correlation ≠ causation and how this eye-opening website teaches critical data literacy.
Introduction: When Data Tells Ridiculous Tales
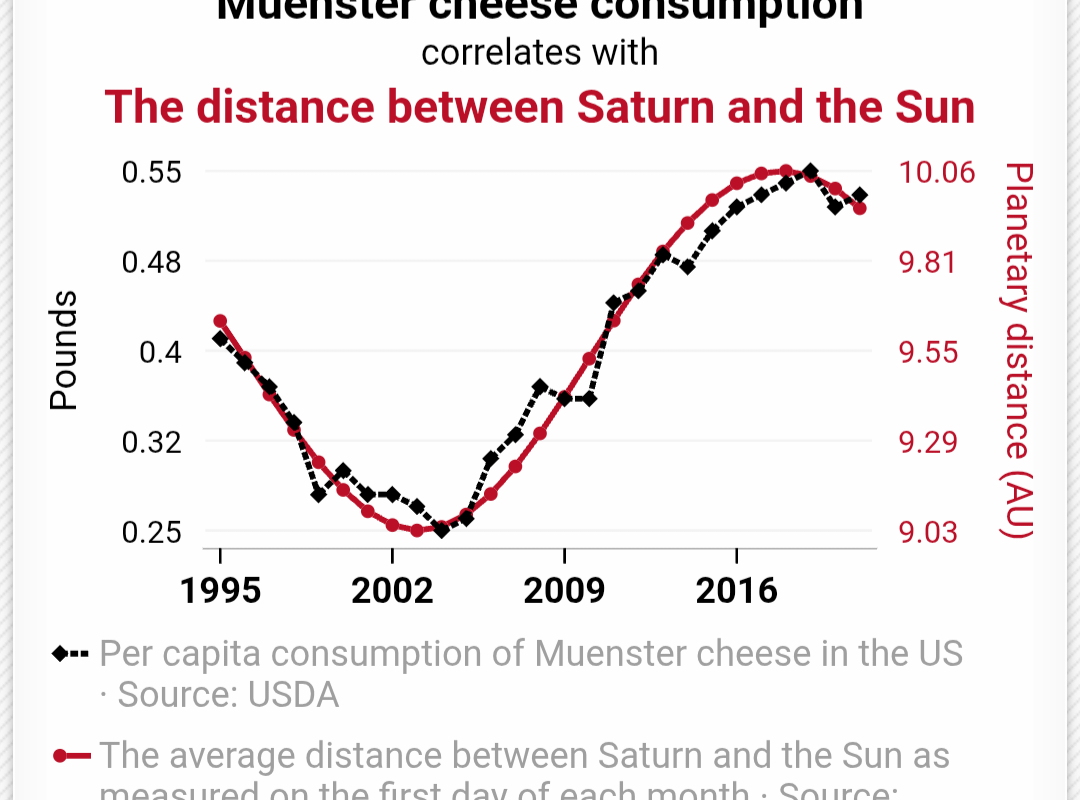
Imagine a world where the number of Nicolas Cage films released in a year perfectly predicts swimming pool drownings. Or where US cheese consumption eerily mirrors the number of people who died tangled in their bedsheets. These absurd connections aren’t fiction—they’re proven by data on Tyler Vigen’s Spurious Correlations, a website hilariously (and terrifyingly) dedicated to exposing how statistics can mislead us.
What Is the Spurious Correlations Website?
Created by Harvard Law graduate Tyler Vigen, the Spurious Correlations Generator (tylervigen.com) mines real-world datasets (e.g., CDC reports, economic indexes) and calculates statistically “perfect” correlations—defined by a Pearson correlation coefficient nearing +1 or –1—between entirely unrelated variables.
How It Works:
- Data Mining: The algorithm pulls datasets from credible sources (government agencies, research bodies).
- Pattern Matching: It tests thousands of variable pairs to find coincidental yet mathematically strong correlations.
- Visualization: Results display as graphs alongside punchy headlines (e.g., “Divorce Rate in Maine vs. Per Capita Margarine Consumption”).
Why These Correlations Are Statistically “Perfect” (But Meaningless)
A high correlation coefficient (r-value) simply means two variables trend together over time. It does NOT imply causation. Consider Vigen’s famous example:
- r = 0.99 between “US spending on science, space, and technology” and “Suicides by hanging, strangulation, and suffocation” (1999–2009).
Why does this happen?
- Random Chance: With enough variables, some will align purely by luck.
- Confounding Factors: Hidden variables (e.g., population growth, economic trends) can create noise.
- Cherry-Picking: Selecting specific timeframes amplifies illusions of causality.
The Dangers of Misinterpreting Data in the Real World
While Vigen’s examples are absurd, they mirror a widespread problem: misused statistics in media, politics, and business.
Real-World Consequences:
- Health Myths: “Vaccines cause autism” (based on debunked correlation).
- Policy Errors: Linking crime rates to video games while ignoring socioeconomic factors.
- Financial Losses: Investors chasing “hot stocks” based on flawed trend analyses.
How to Avoid Falling for Spurious Correlations
- Question Causality: Ask, “Could there be a hidden factor linking these?”
- Check Sample Sizes: Small datasets increase coincidental matches.
- Replicate Analyses: Does the correlation hold over different time periods or regions?
- Consult Experts: Statisticians can identify confounding variables or biases.
Why the Spurious Correlations Website Matters
Beyond laughs, this tool is a masterclass in data literacy. It teaches us to:
- Spot Red Flags in headlines (“X causes Y!”).
- Demand Proof of mechanistic links, not just trends.
- Embrace Skepticism in an era of data overload.
Try It Yourself: Play with the Generator!
The site lets users generate their own absurd correlations. Try pairing “Organic avocado sales” with “UFO sightings”—you might just discover the next viral hoax!
Conclusion: Correlation ≠ Causation (and That’s a Good Thing)
Tyler Vigen’s Spurious Correlations reminds us that data tells stories—but not always truthful ones. In a world drowning in metrics, critical thinking is our life raft. So next time you see a “perfect” correlation, channel your inner skeptic: It’s probably just Nicolas Cage’s fault.
SEO Keywords: Spurious correlations, Tyler Vigen, correlation vs causation, statistical fallacies, data literacy, misleading statistics, correlation generator.
CTA: Ready to fall down the rabbit hole? Explore the Spurious Correlations website and test your own bizarre data pairs today!