Source: Daniel Jeffrey (Metriq)
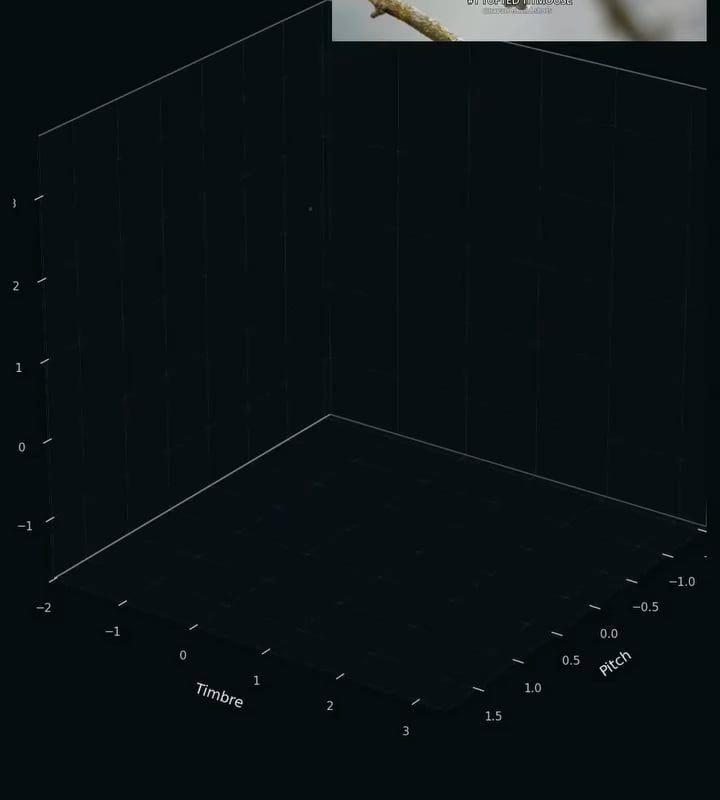
Imagine stepping into a lush forest, surrounded by the sweet melodies of birds singing their hearts out. The air is filled with a cacophony of chirps, trills, and warbles, each one a unique voice in the grand symphony of nature. But have you ever wondered what these bird sounds would look like if we could visualize them? A team of innovative researchers has been working on doing just that – mapping bird sounds as graphs, and the results are nothing short of fascinating. By transforming the audio signals of bird songs into intricate graphs, scientists can gain a deeper understanding of the complex language of our feathered friends.
Unraveling the Secrets of Bird Communication
For years, ornithologists have been studying the various ways in which birds communicate with each other. From the distinctive songs of individual species to the subtle variations in pitch and tone, each bird’s vocalization is a unique identifier that conveys vital information about its identity, location, and intentions. By mapping these sounds as graphs, researchers can identify patterns and structures that were previously unknown, shedding new light on the intricate social dynamics of bird communities. This groundbreaking work has the potential to revolutionize our understanding of bird behavior, allowing us to better appreciate the complex social lives of these incredible creatures.
The Science Behind Sound Mapping
The process of mapping bird sounds as graphs involves a combination of advanced audio analysis software and sophisticated mathematical algorithms. By breaking down the audio signals into their component frequencies and amplitudes, researchers can create detailed visual representations of each bird’s song. These graphs can then be compared and contrasted to identify similarities and differences between individual birds, as well as between different species. The resulting visualizations are not only stunningly beautiful but also provide a wealth of information about the underlying structure and organization of bird communication. As scientists continue to refine this technique, we can expect to gain even deeper insights into the fascinating world of bird language.
A New Era of Bird Research
The implications of this research are far-reaching, with potential applications in fields such as conservation, ecology, and even musicology. By analyzing the visual patterns and structures of bird songs, researchers may be able to develop new methods for identifying and tracking individual species, or even for monitoring the health and well-being of bird populations. Additionally, the study of bird sounds as graphs could inspire new approaches to music composition and audio design, as scientists and artists alike seek to tap into the creative potential of nature’s own symphonies. As we continue to explore the fascinating world of bird communication, we may uncover even more surprising secrets and insights, each one a reminder of the awe-inspiring beauty and complexity of the natural world.
As we listen to the sweet songs of birds, we are reminded of the incredible diversity and complexity of the natural world. The mapping of bird sounds as graphs is a powerful tool for unlocking the secrets of bird communication, and its potential applications are vast and exciting. Whether you’re a seasoned ornithologist or simply a nature lover, the world of bird sounds is sure to captivate and inspire, offering a unique glimpse into the hidden lives of our feathered friends. So next time you’re out in nature, take a moment to stop and listen – you never know what secrets the birds might be singing about.